Start with preliminary planning if you want, and compile the project charter. Or, proceed to the advanced planning to create a full Project Management Plan.
iziPM is a web app, no need to install anything. Works with Windows, MacOS, Linux and any other OS.
Project info
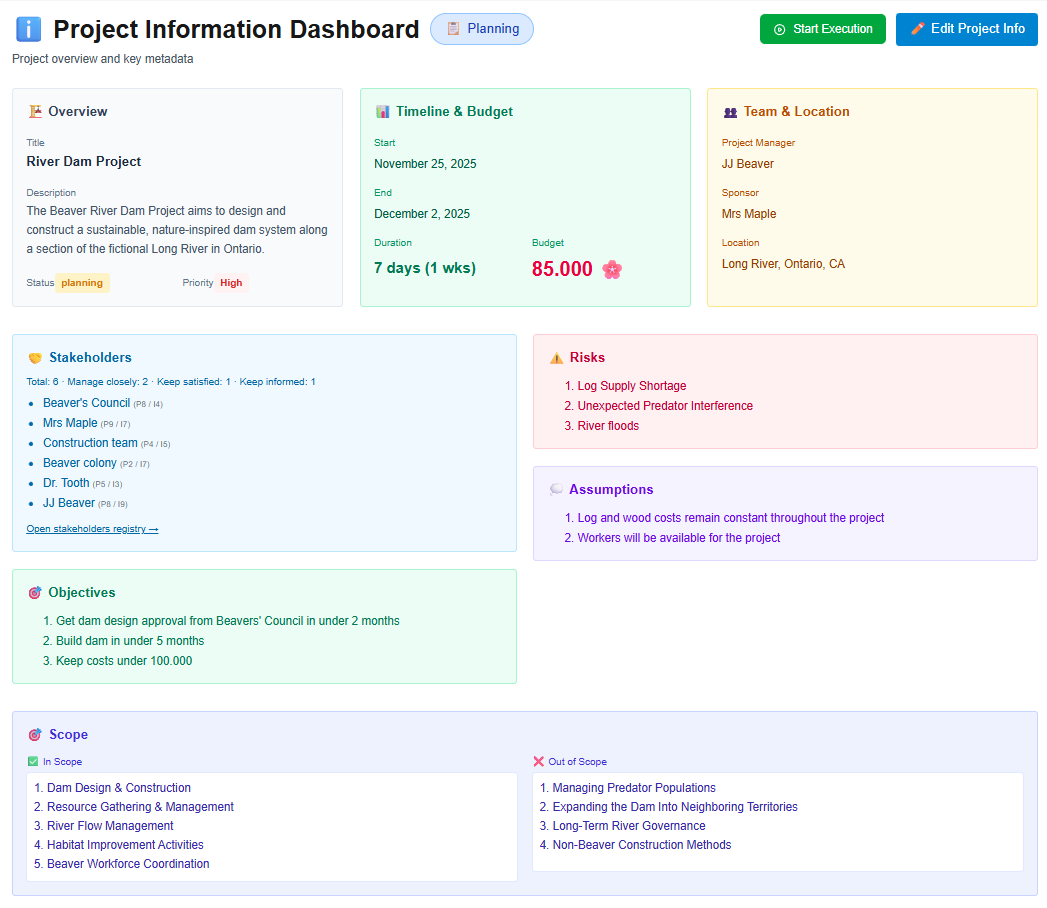
Centralize project details and key metrics in one place. Manage scope, status, costs, duration, and revenues with automatic roll-ups.
The Project Info section provides a single, structured place to define and manage all essential project information. Capture core details such as project name, project area, client, sponsor, status, scope, and objectives—creating a clear and consistent project identity from planning through execution.
In addition to descriptive data, Project Info automatically aggregates key roll-up indicators from all other project sections. Instantly view total project duration, planned and actual costs, expected revenues, and high-level financial and schedule metrics without manual calculations.
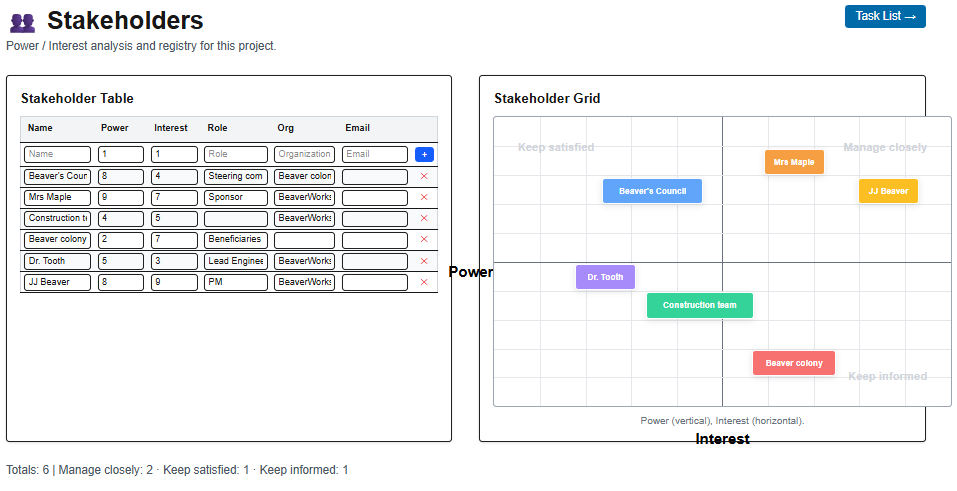
Stakeholders
Identify, assess, and map project stakeholders using a power-interest matrix to improve engagement, communication, and decision-making.
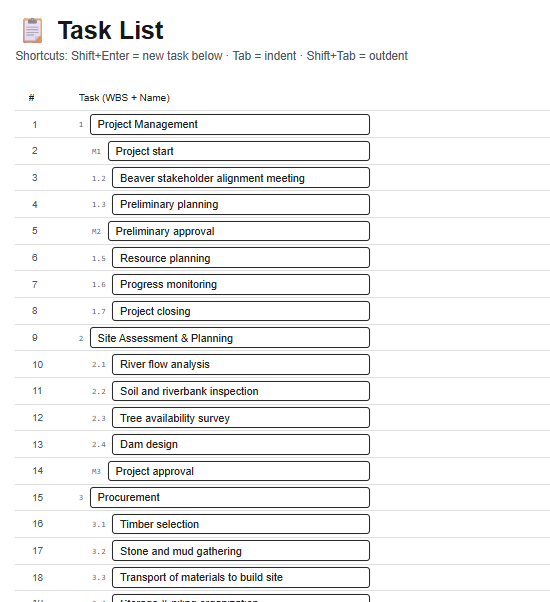
Task list / WBS
Quickly build your task list, indent tasks to create a hierarchy, and add milestones. Tasks are automatically numbered, and milestones use a distinct visual coding.
Easily move tasks within the list to organize them and their subtasks.
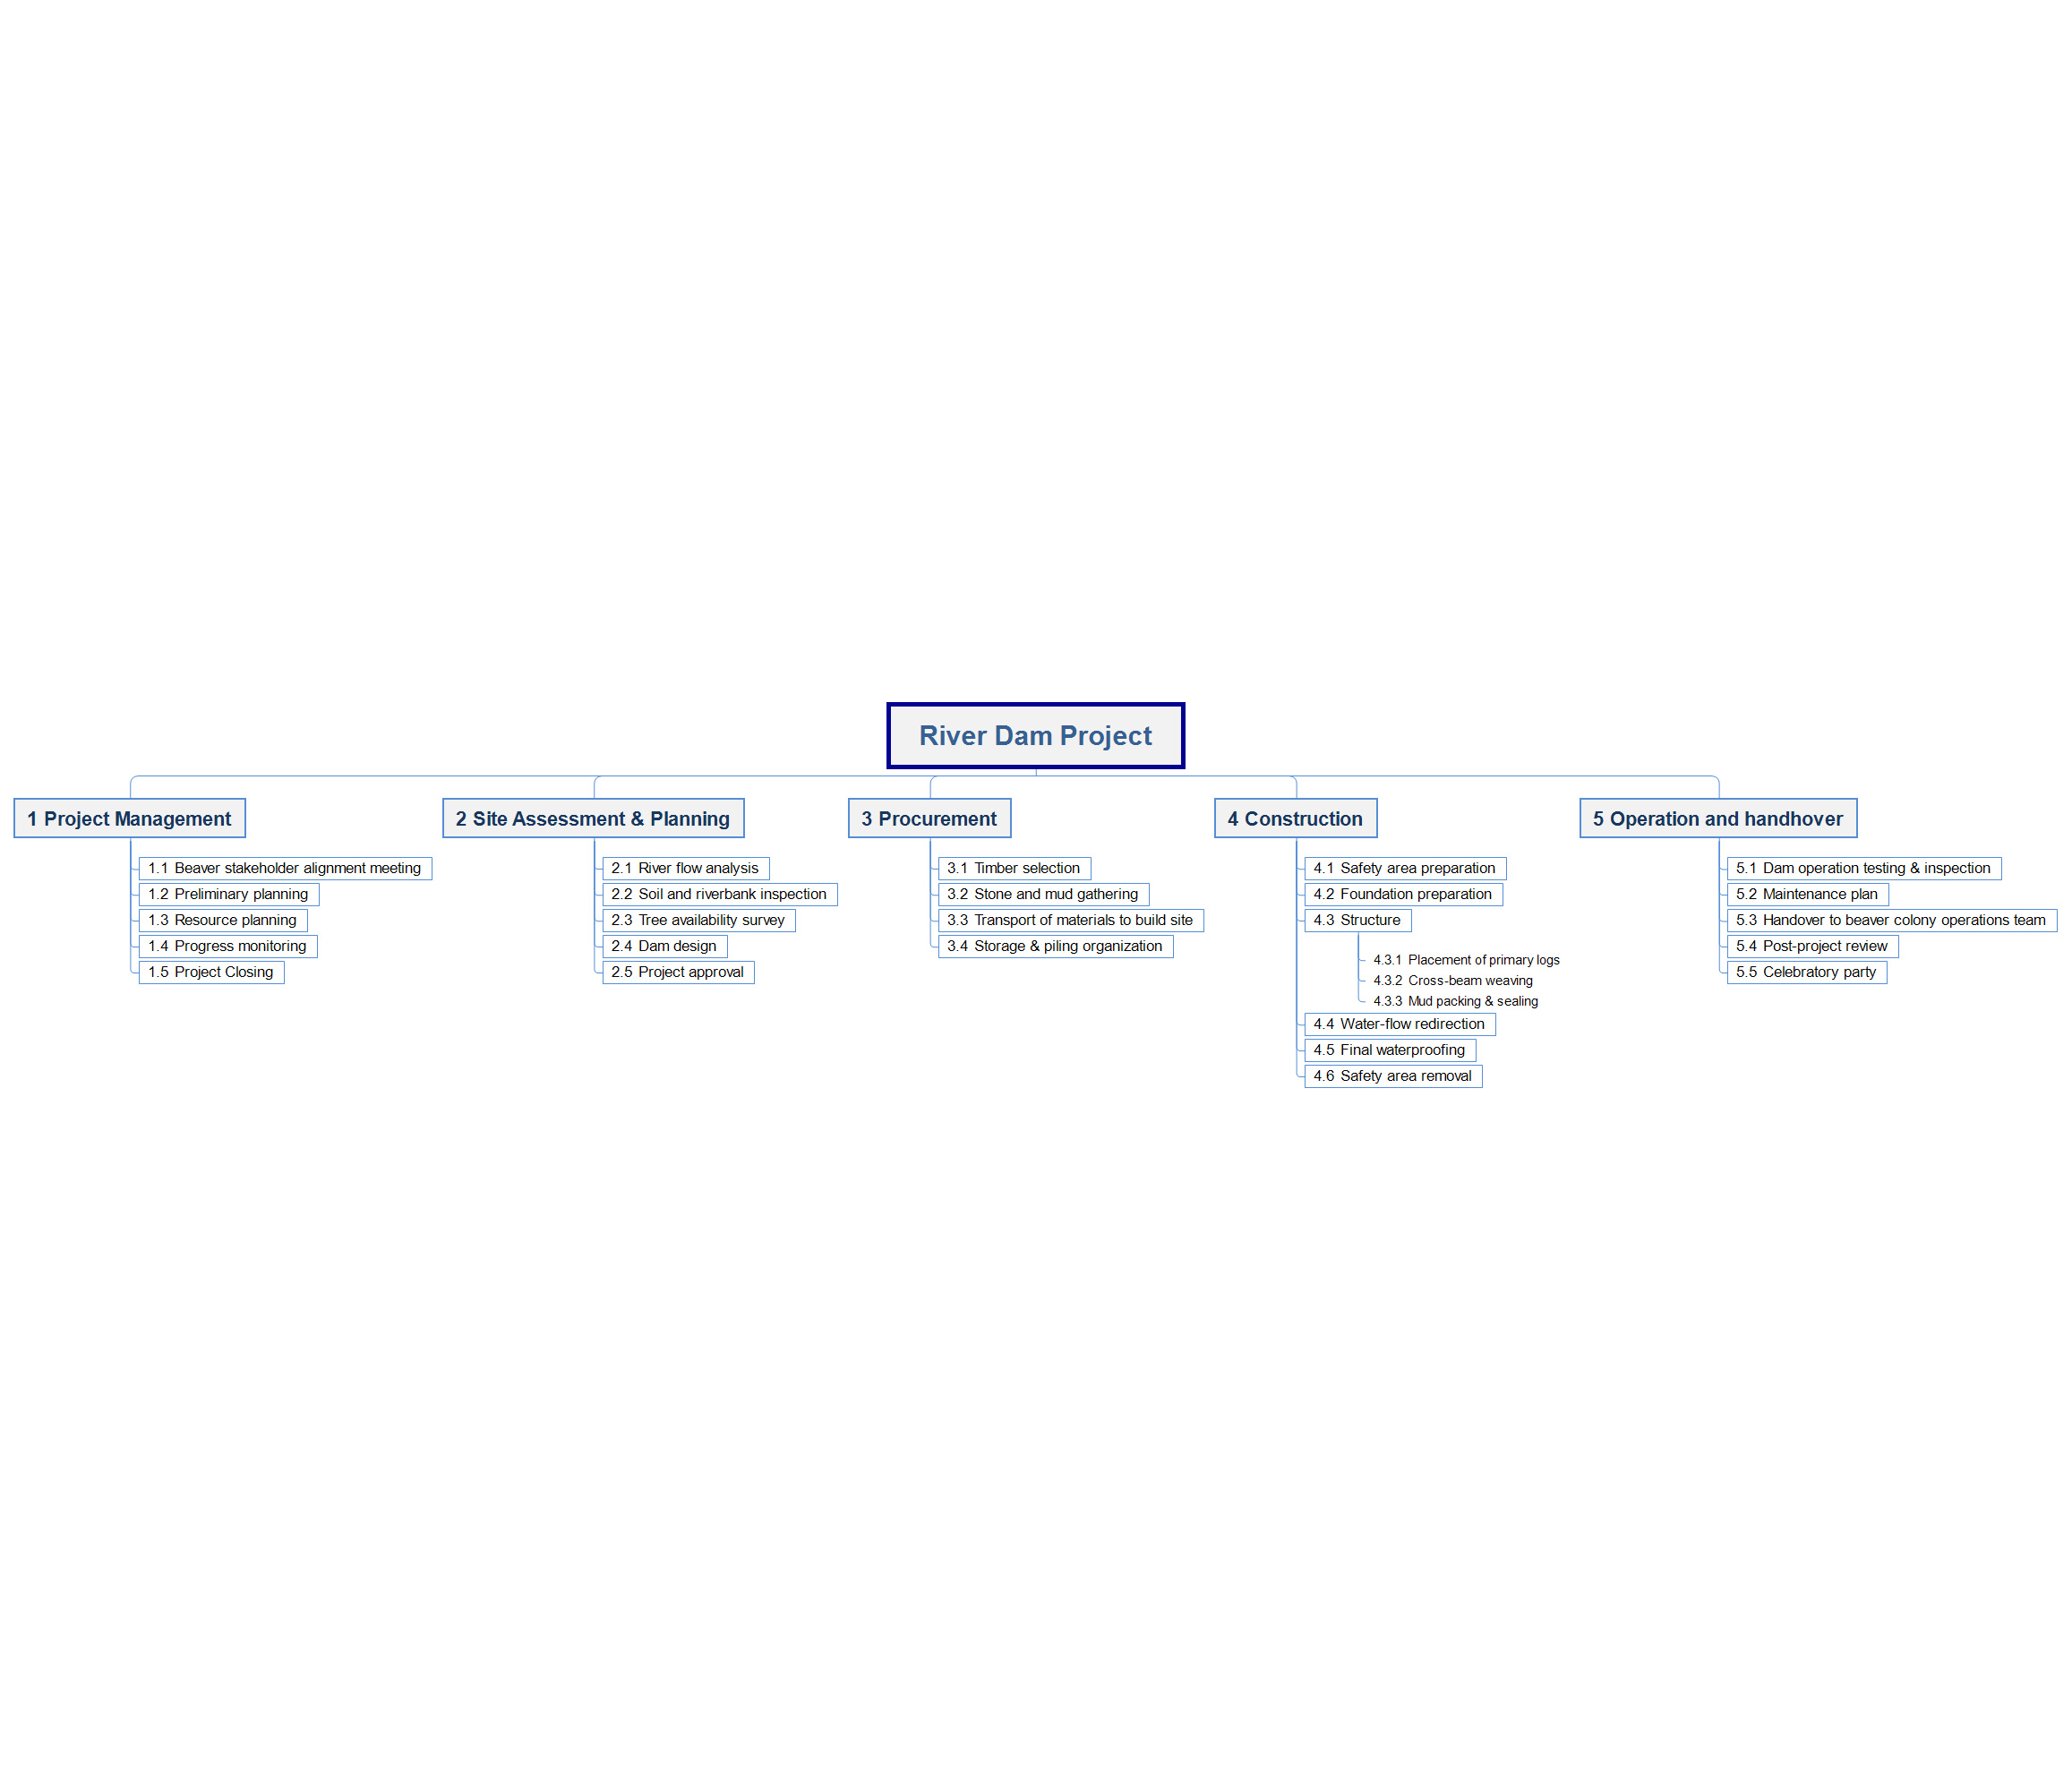
Generate a Work Breakdown Structure (WBS) chart that auto-formats itself — no need to worry about spacing, alignment, or broken and incorrect numbering.
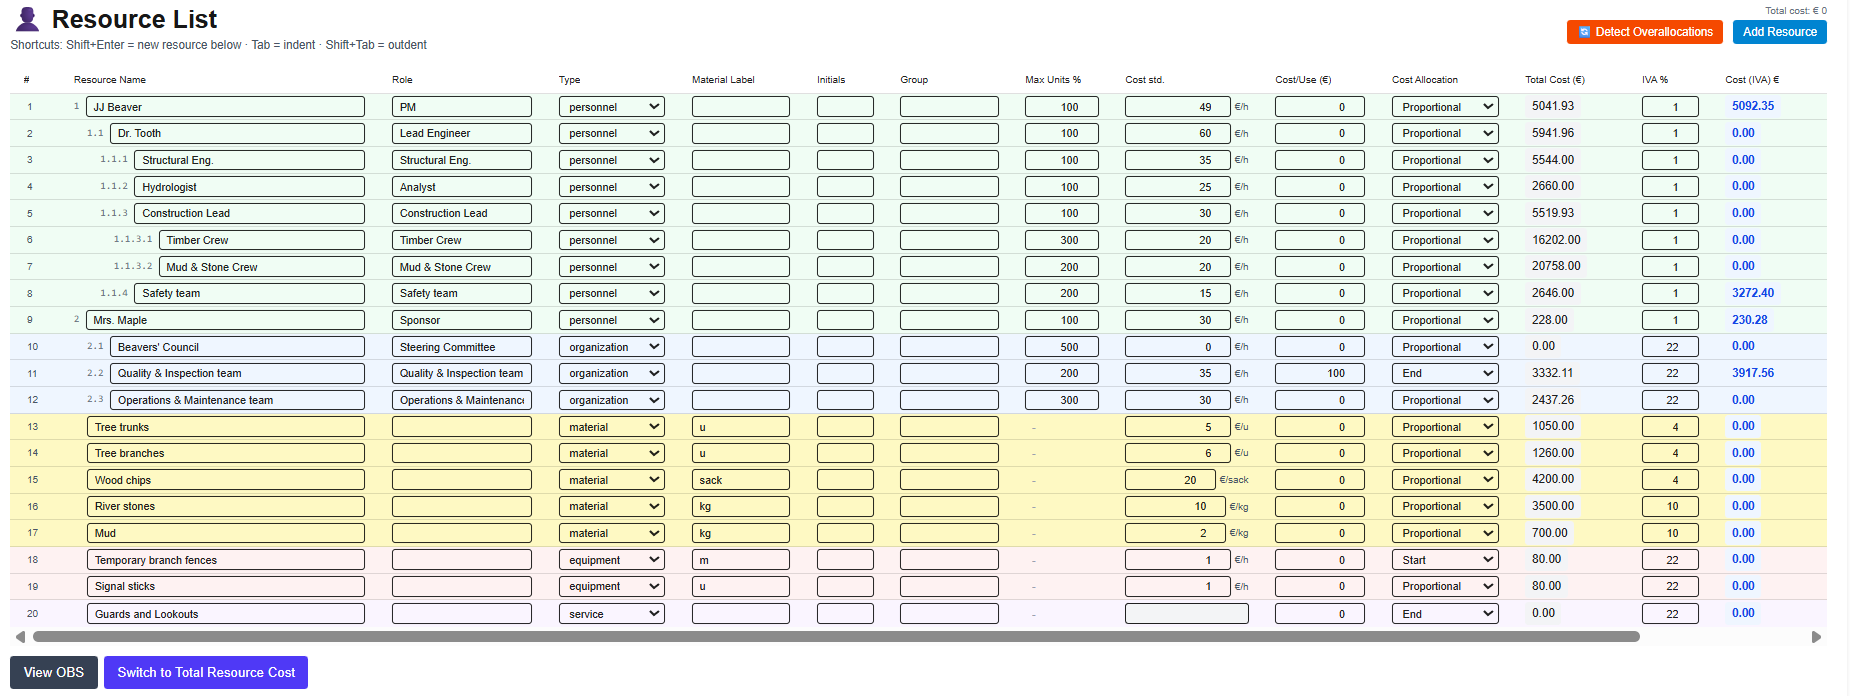
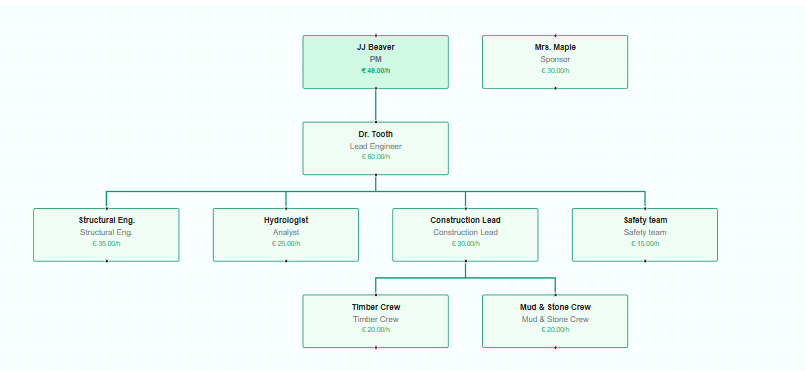
Resource list / OBS
Manage project resources (personnel, materials, equipment, and services), including availability and unit costs, with net cost and VAT shown separately. Detect and resolve resource overallocations.
Automatically generate the Organizational Breakdown Structure (OBS).
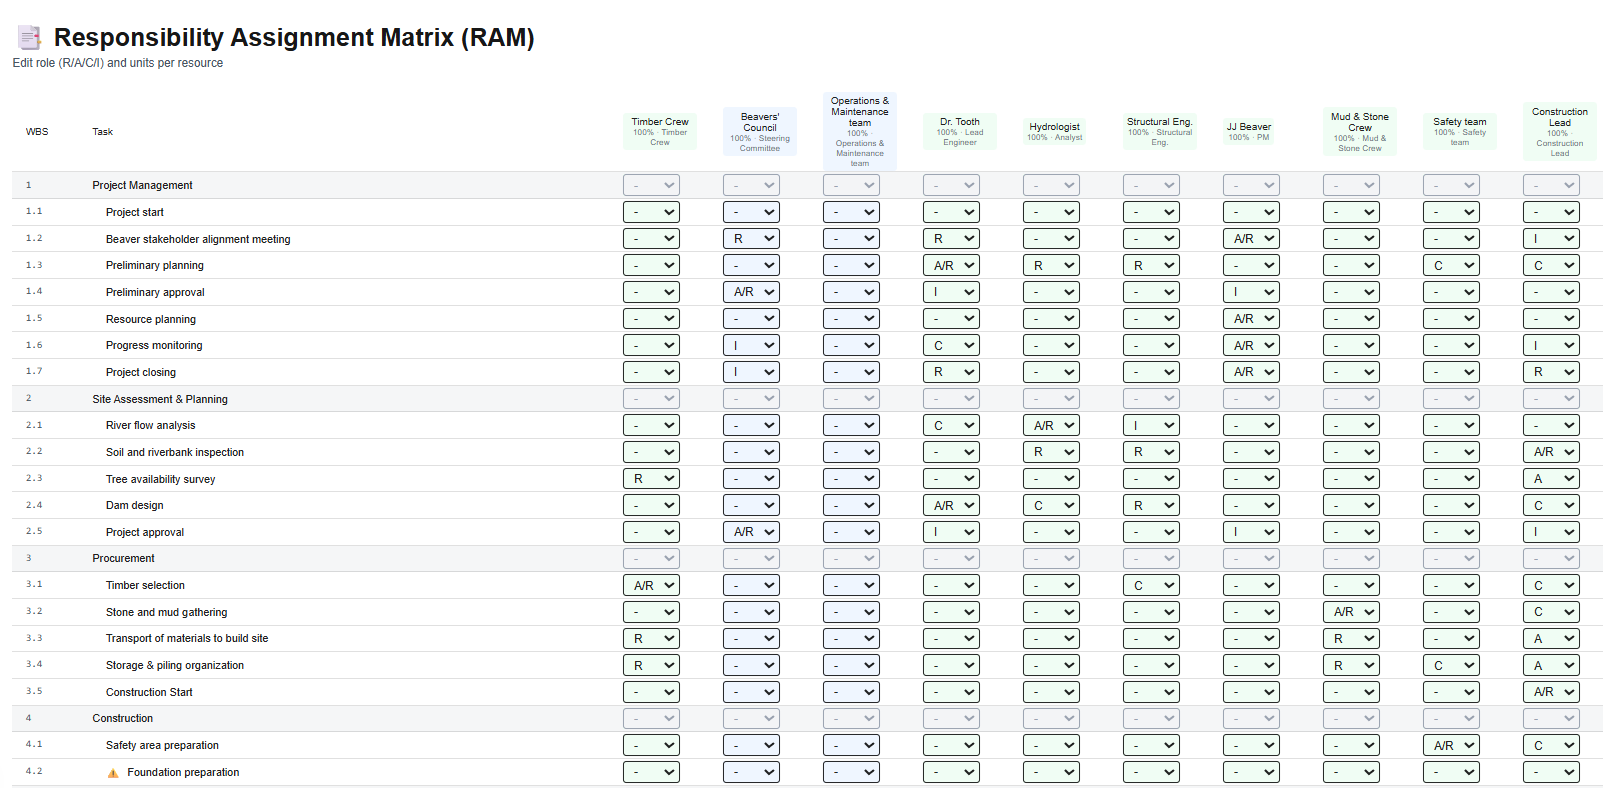
RAM – Responsibility Assignment Matrix
Quickly compile the Responsibility Assignment Matrix (RAM) using RACI or RASIC conventions, ensuring that every task has a clearly defined accountable and/or responsible role.
This section also feeds the Gantt chart, allowing you to proceed directly with effort assignment. Any new resources added remain automatically synchronized across all project sections.
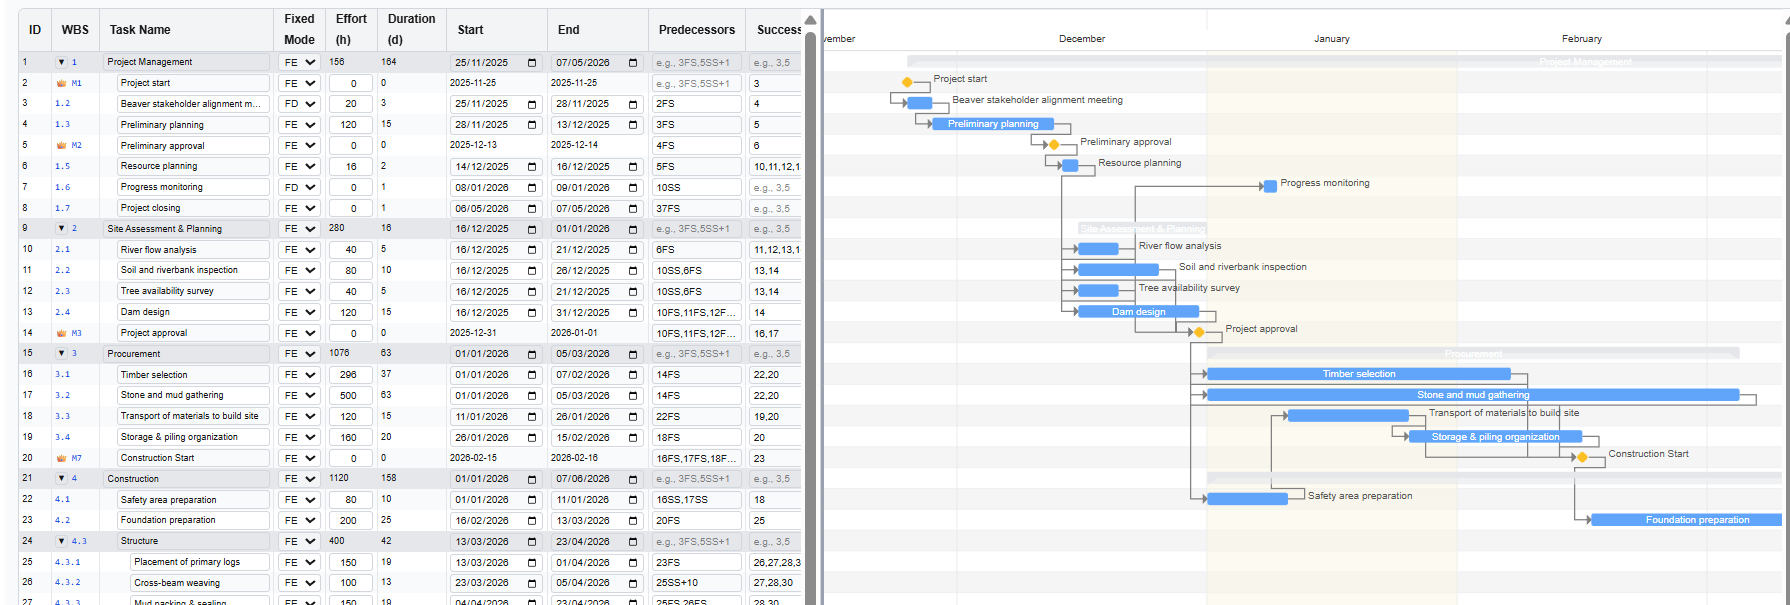
Gantt chart
Pre-populated with information from the Task List, Resource List, and Responsibility Assignment Matrix (RAM), the Gantt chart requires only the remaining inputs to be completed: task type (fixed work, fixed duration, or fixed units), task dependencies, resource effort or task duration, and any additional constraints.
View the critical path wht the CPM, level resources to solve overallocations and complete your project schedule.
Add, move, or remove tasks or milestones, and every change is automatically synchronized with the corresponding project sections, keeping all information aligned and consistent throughout the project.
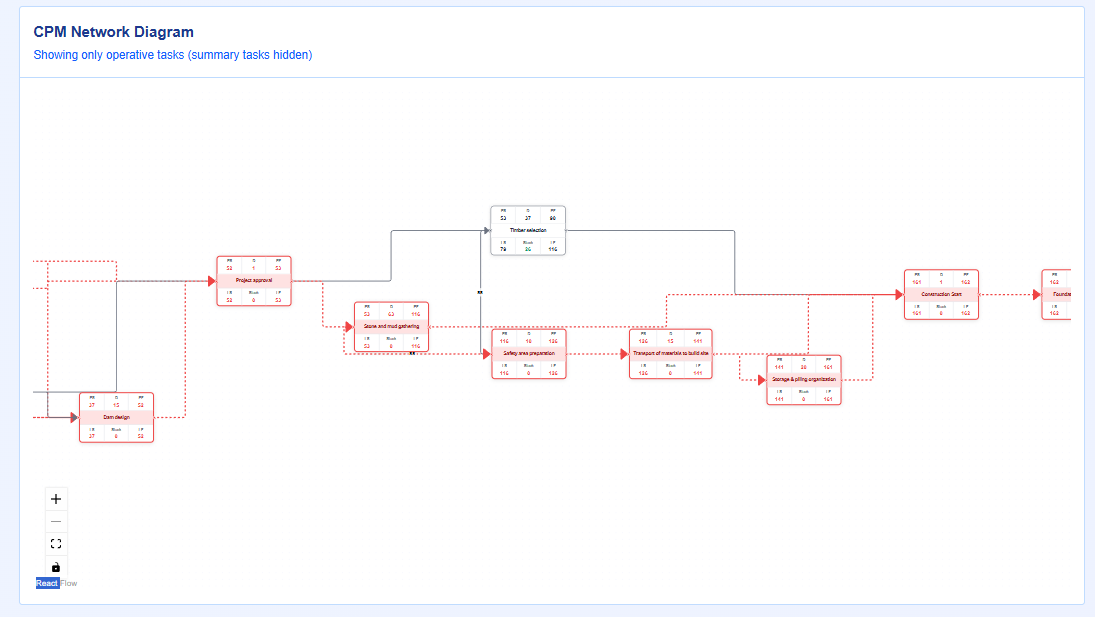
Network Diagram / CPM
This section generates the Network Diagram and highlights the Critical Path calculated using the Critical Path Method (CPM).
Each node displays the standard information fields: Early Start, Duration, and Early Finish at the top, and Late Start, Total Float, and Late Finish at the bottom.
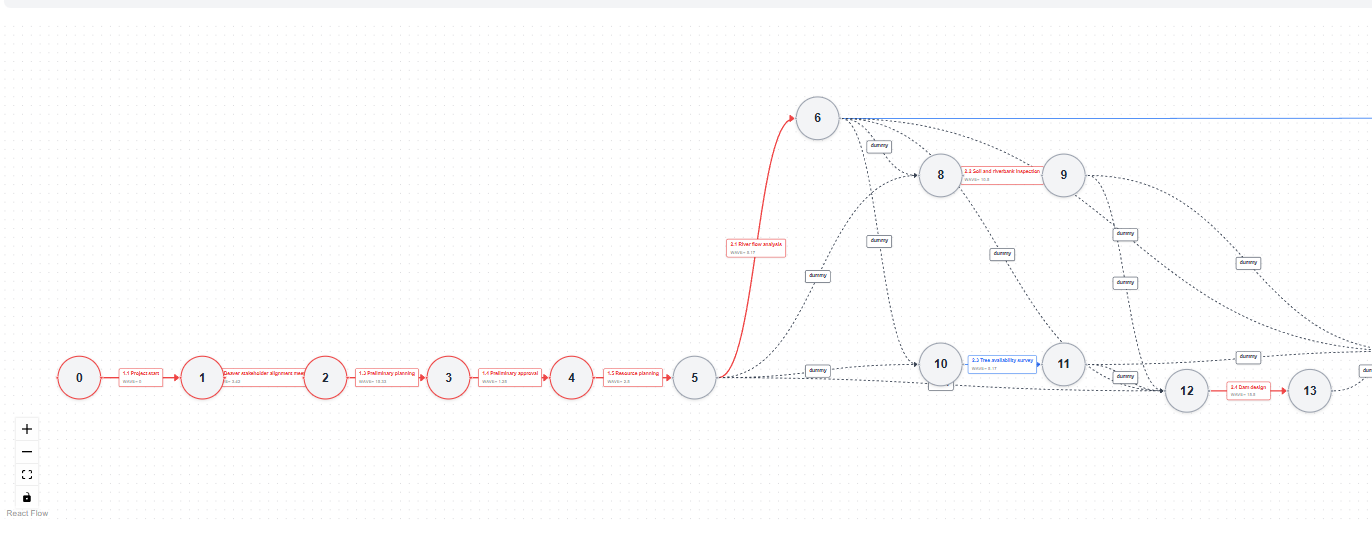
PERT chart
Create and generate the PERT chart for probabilistic estimation of project duration. Using the task durations defined in the Gantt chart as the Most Likely values, you can add Optimistic (best-case) and Pessimistic (worst-case) estimates for each task. The Critical Path is then calculated using this technique, enriching the schedule with statistical analysis.
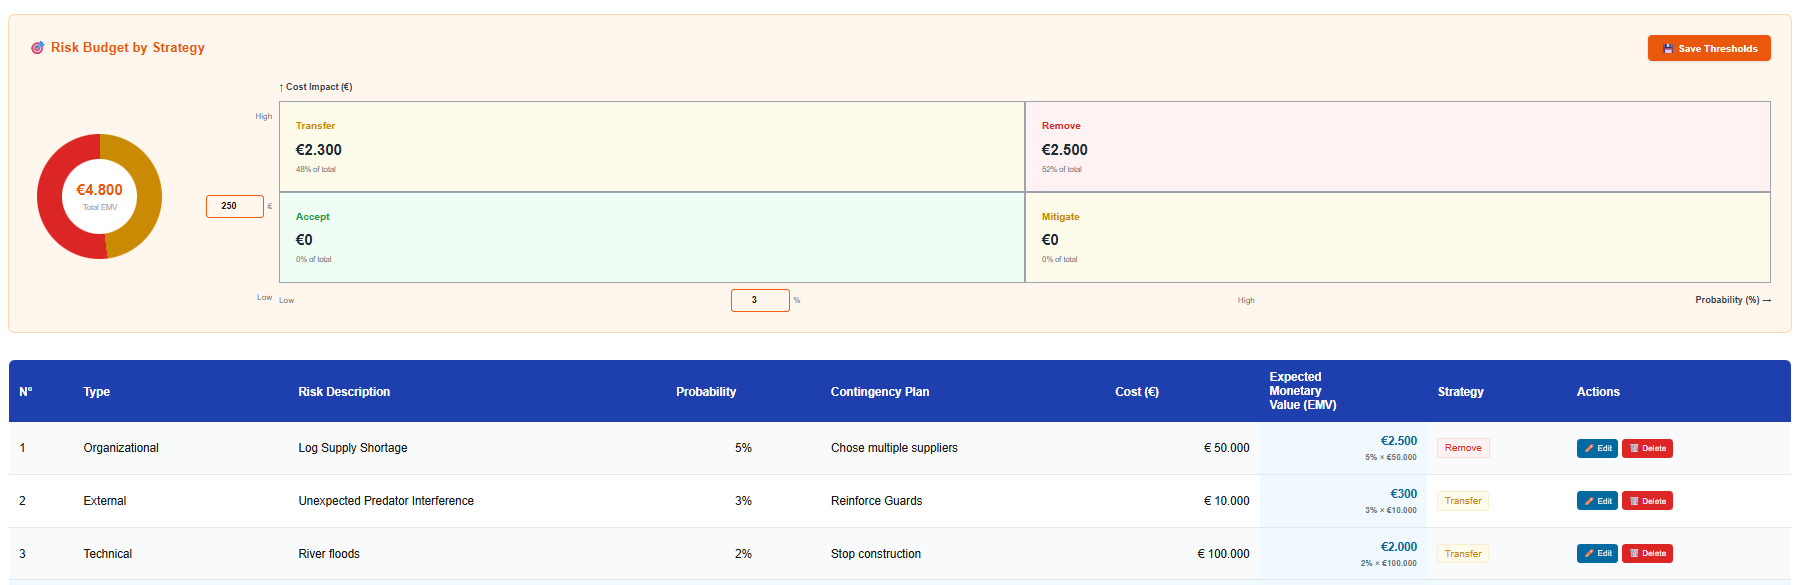
Risks
This section allows you to identify and classify project risks, plan contingencies, and automatically add the Expected Monetary Value (EMV) to the project budget in the following section.
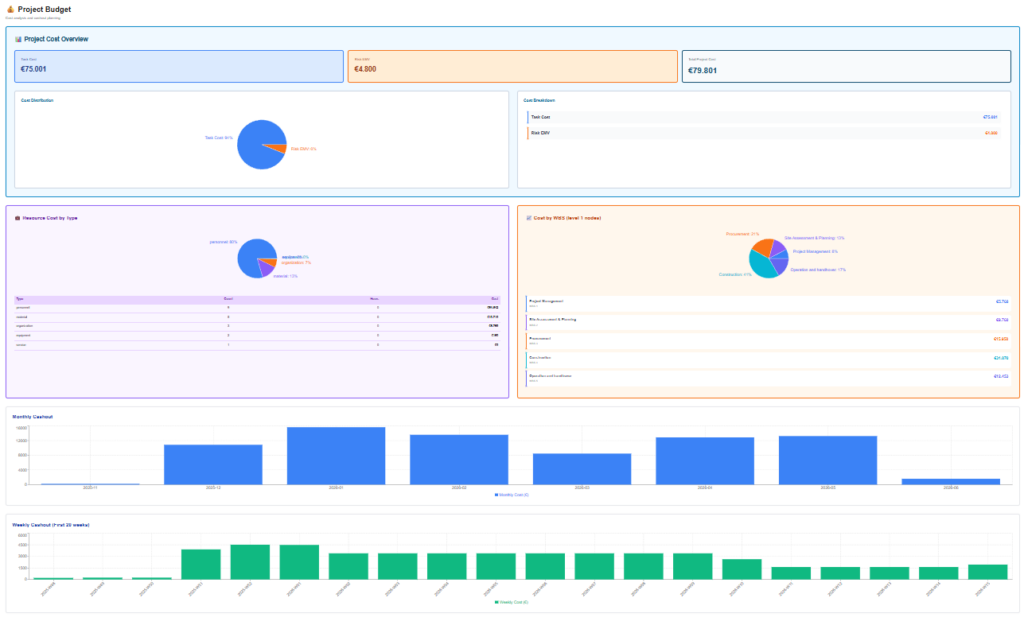
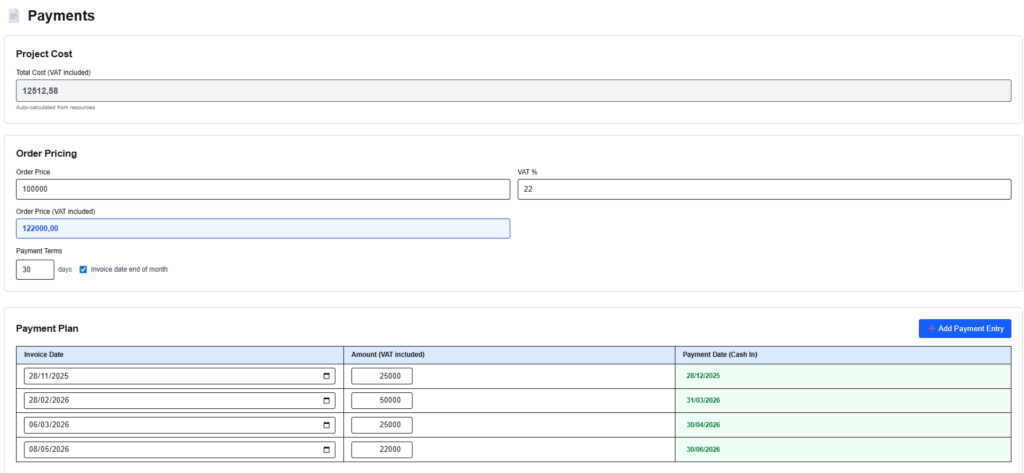
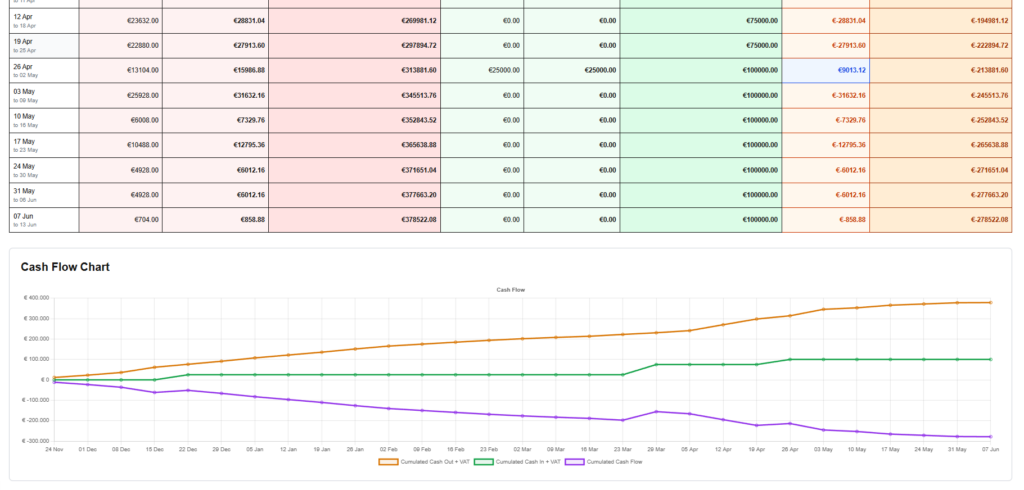
Financials
Financial planning for your project is supported by three integrated tools: a budget dashboard, showing cost distribution by type and weekly or monthly cost trends; a payment table, where expected revenues can be defined; and cash flow charts, providing a comprehensive view of the project’s financial profile.
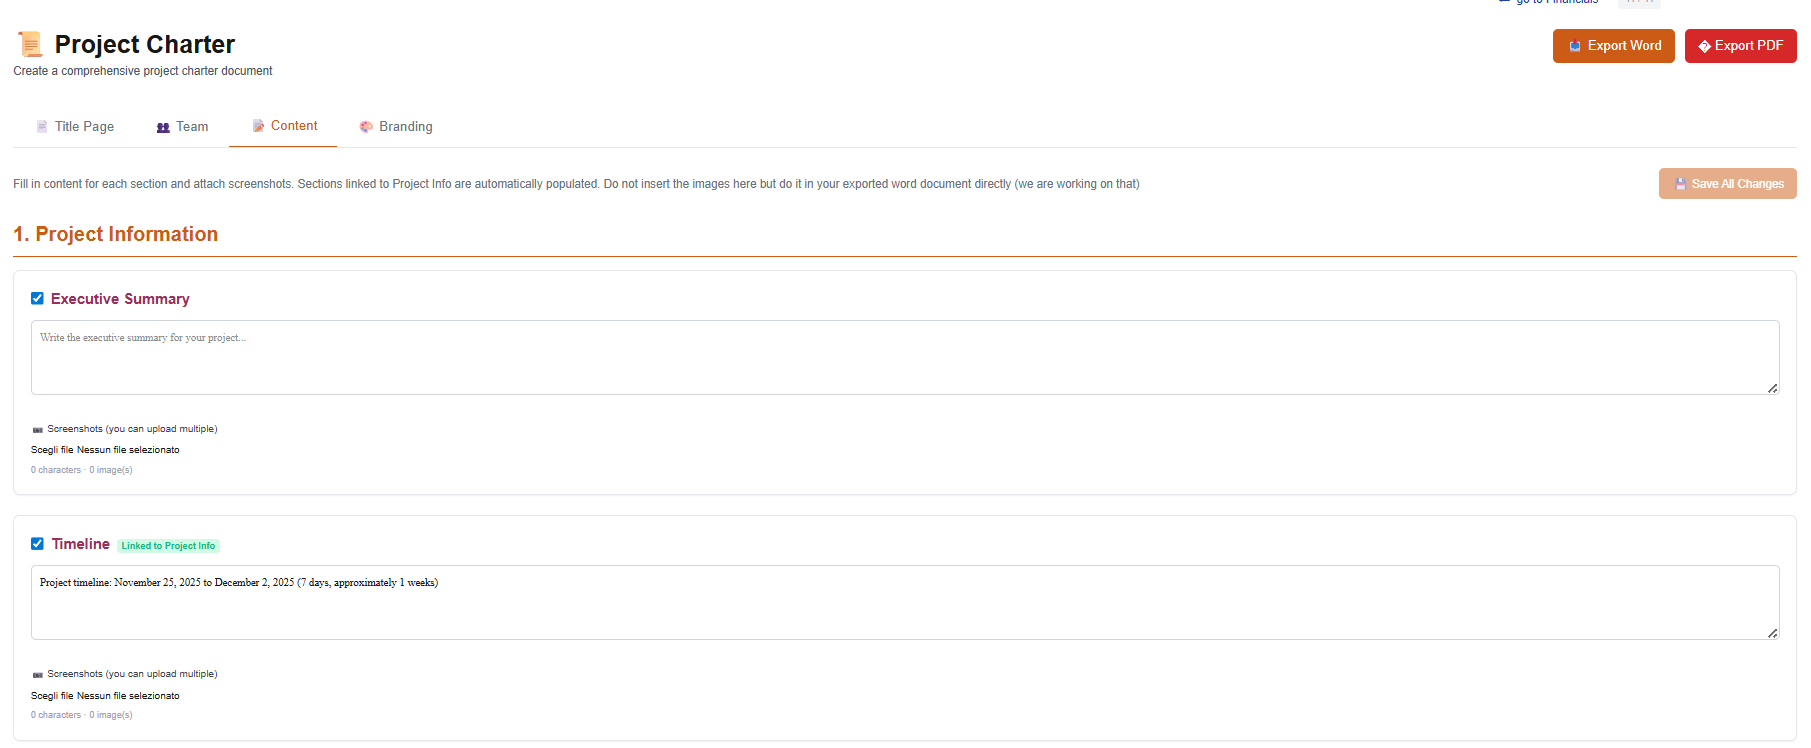
Project Management Plan – export
Quickly export consolidated project information into a Project Management Plan document for further editing or review.
iziPM functionalities for tracking phase
Monitor and control your projects the izi way: simple yet complete functionalities to log hours, actual costs, and track progress
Gantt chart (execution/tracking)
During execution, the Gantt chart becomes the control center of your project. Track actual progress against the baseline, monitor task status, and keep timelines under control in real time.
Update task progress, remaining work, or actual effort directly on the chart, and instantly see the impact on dates, dependencies, and milestones. Critical Path updates dynamically as execution data changes, helping you anticipate delays before they become issues.
Timesheets and actual costs log
Capture real project execution data with a simple and structured timesheet and cost logging system. Team members record hours worked per task and day, while external costs (materials, services, expenses) are logged directly against project activities.
With built-in controls on availability and workload, the timesheets ensure consistent, reliable data—turning daily inputs into actionable insights for project managers and stakeholders.
Project dashboard
The Project Dashboard gives project managers an immediate, data-driven view of project performance during execution. All key indicators are calculated automatically from planning data, timesheets, and actual costs—no manual reporting, no disconnected spreadsheets.
Monitor schedule and cost performance in real time with Earned Value metrics such as Planned Value (PV), Actual Cost (AC), Earned Value (EV), Schedule Performance Index (SPI), and Cost Performance Index (CPI). Instantly identify delays, cost overruns, and forecast final duration and cost using Estimate at Completion (EAC) and Estimate to Complete (ETC).
The dashboard also tracks milestone status, overall project health, and cash flow trends, providing a single, reliable source of truth for project control, decision-making, and stakeholder reporting.
Other functionalities
Export
Export your project data to common formats such as CSV, Excel, and MS Project to ensure full interoperability with existing tools and workflows. Easily reuse schedules, costs, resources, and execution data for reporting, analysis, or continued project control—without rework or data loss.
Import from other tools / software
Import project data from popular project management software and standard formats such as Excel, CSV, and MS Project. Quickly reuse existing schedules, task lists, resources, and costs to start planning or tracking without rebuilding your project from scratch.
Get Early Access to iziPM
Register for early access to iziPM and get priority access, exclusive benefits, and a tool designed around international PM standards.